Smarter Navigation, Better Visit Control – See What’s New
Our latest Perspective Observatory release is packed with meaningful updates to help you work more efficiently and gain deeper insights. You’ll now find enhanced analysis in the MIS area, including new dashboards for staff workforce and attendance, giving you clearer, easier access to the data that matters most.
We’ve also introduced major enhancements to how Visits work. Visit Admins can now edit any Visit, control who sees what (and when), and link directly to external documents. Draft Visits and individual attachments can now be hidden from schools, giving you even more flexibility and control over what’s shared.
These updates help you analyse data more easily and manage visits with greater flexibility.
Here’s what you’ve got to look forward to:
Visits – More Flexibility and Control
Admin Editing of Visits – Previously, only the visit creator could make changes. Now, users with Admin permissions on Visits can edit any Visit in your organisation.
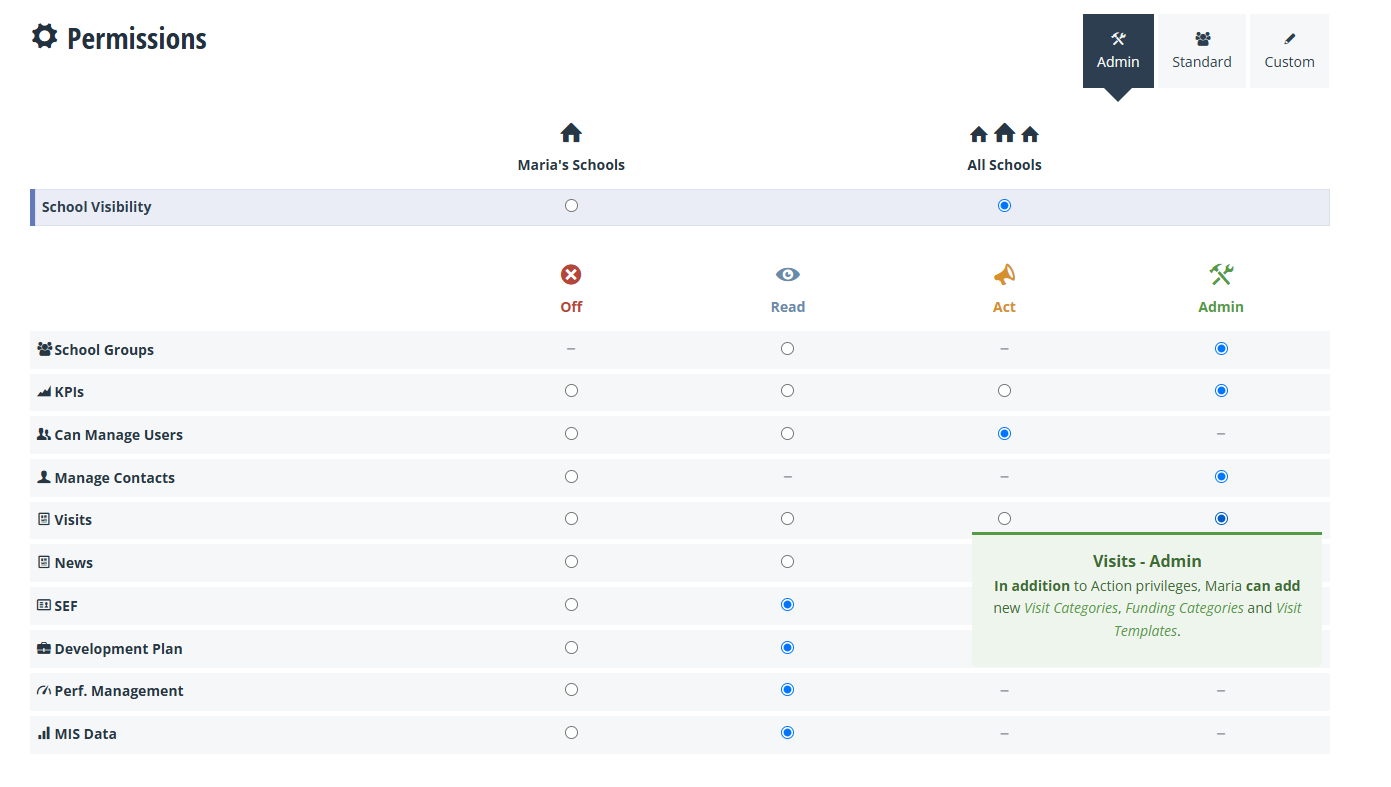
Control the Visibility of your Visits – You now have more control over who sees what, and when:
- Choose visibility for each Visit: Private (me & Admins), Teams and Users (me & Admins), and All Users (not restricted)
- Refine school-level visibility: Attachments or links to files are shown to schools by default, but you can now hide individual attachments/files from schools, too.
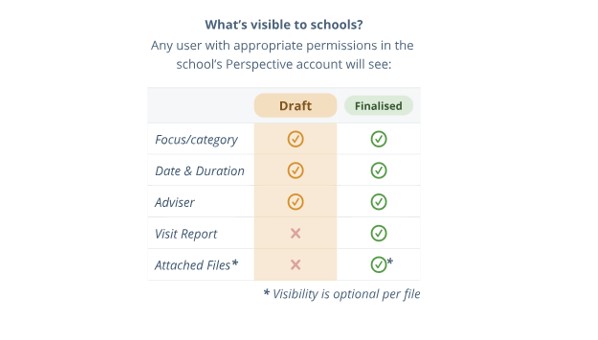
- School users with the relevant permissions in Perspective Lite have always been able to see “Draft” and “Finalised” Visits. Now, you can control when they see a Visit or even “hide” a Visit completely.
Please note that only users with access to Visits and the school(s) in question will see your Visits, and not everyone in the organisation.
Add External Links to Visits – You can now link external documents directly to a Visit (e.g., a SharePoint document or a Dropbox file), which is perfect for referencing key evidence or support materials.
MIS Analysis – Staff Workforce and Attendance
We’re enhancing our MIS Analysis dashboards with new insights into Staff Workforce and Attendance. These additions extend your existing MIS Analysis by providing a clear, contextual view of your staff across all schools, including roles, demographics, and absence patterns.
As with your existing pupil data views, the new Staff Workforce dashboards highlight any gaps or inconsistencies in your MIS, helping you improve data quality and get the most from your data.
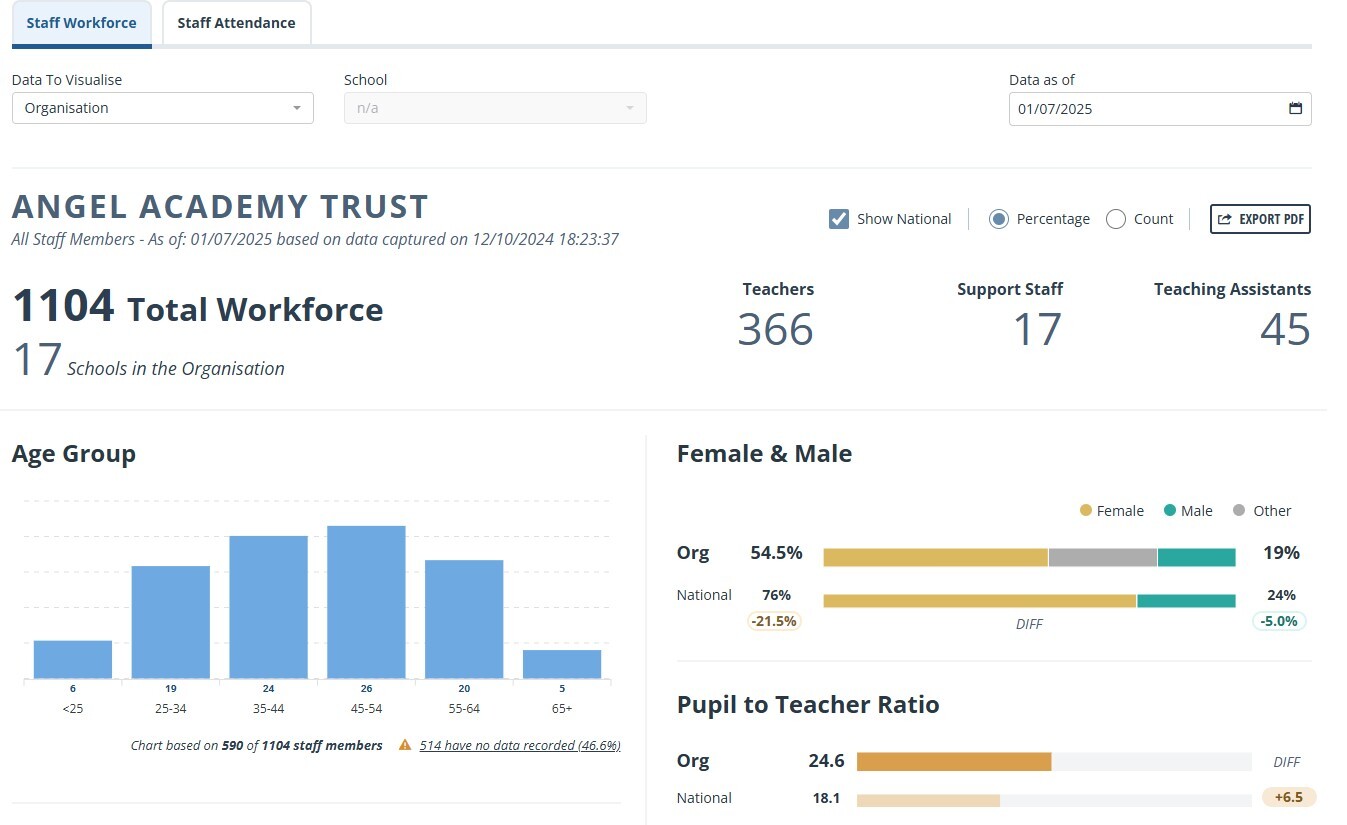
Staff Workforce – The new “Workforce” tab presents key staff insights through clean, easy-to-read charts, covering:
- Age Group
- Gender
- Roles in Schools
- Length of Service
- Ethnicity
- Contract Type
- Total Staff Count
This enhancement gives you a clear understanding of your workforce profile, empowering you to make strategic decisions that support the well-being and development of your organisation.
You can easily toggle between organisation-level and school-level views, helping you compare and analyse staff data across your settings. The dashboards also allow you to compare yourself to benchmark data to support further insight. Dashboards can be exported as PDFs, making it simple to report findings and share insights with key stakeholders.
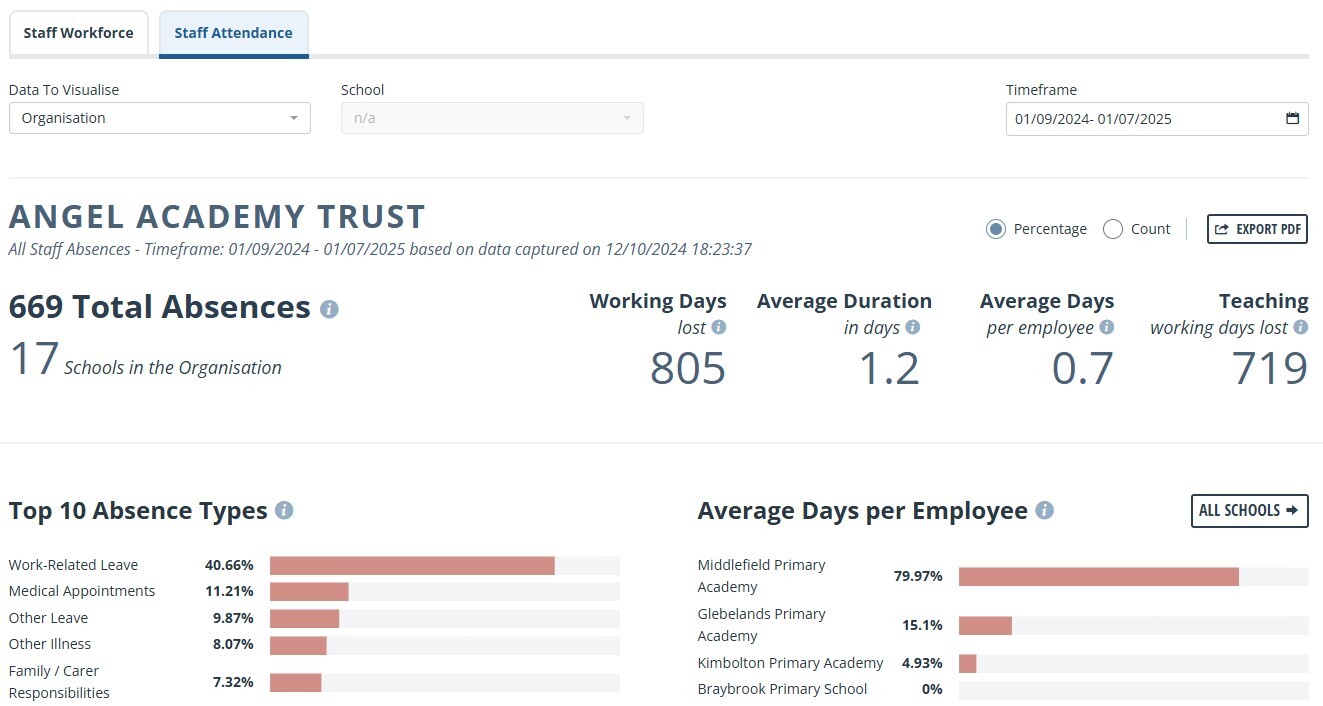
Staff Attendance – The new Attendance tab gives you a comprehensive view of staff absence data across your organisation, with the ability to drill down to individual school levels. It provides detailed insights into absence trends, helping you understand not just how often staff are off, but why.
Key areas covered include:
- Absence Type– Understand the most common reasons for absence, with clear breakdowns to help you spot emerging issues such as work-related stress, medical leave, or caring responsibilities.
- Average Days of Absence per Employee– Shows the average number of days lost per employee at each school, along with how each school compares to the organisation-wide average. This helps identify schools with higher-than-expected absence levels and supports targeted interventions.
- Absence Over Time– View monthly trends and compare this year with last year to detect patterns, seasonal fluctuations, or longer-term changes in staff well-being.
All data can be filtered by date range and exported in .xlsx format, enabling further analysis, sharing, and integration with your internal reporting tools.
These insights support evidence-based decision-making, allowing you to take timely, proactive steps to manage staff attendance, reduce disruption, and better support workforce wellbeing across your Organisation.
The Power of the “My Schools” Group
Do any of your users oversee a group of schools? Set up their ‘My Schools’ group in User Management to reflect this. You can even restrict their access so they only work with those specific schools – ideal if that mirrors your current setup.
Please check out our help guides or contact our support team if you need help. We hope you enjoy the latest updates, and we can’t wait to hear your feedback.
Sign up to one of our upcoming webinar sessions where we will guide you through our latest features…
Ready to get started?
Sign in now and see the updates for yourself.
Not currently a Perspective Observatory Premium user?
Join us for a demo and we will show you how our users are benefitting.
If you or any colleagues would like training on any aspect of Observatory or have any other questions, please, don’t hesitate to contact us.